
Foot Traffic Year-over-Year
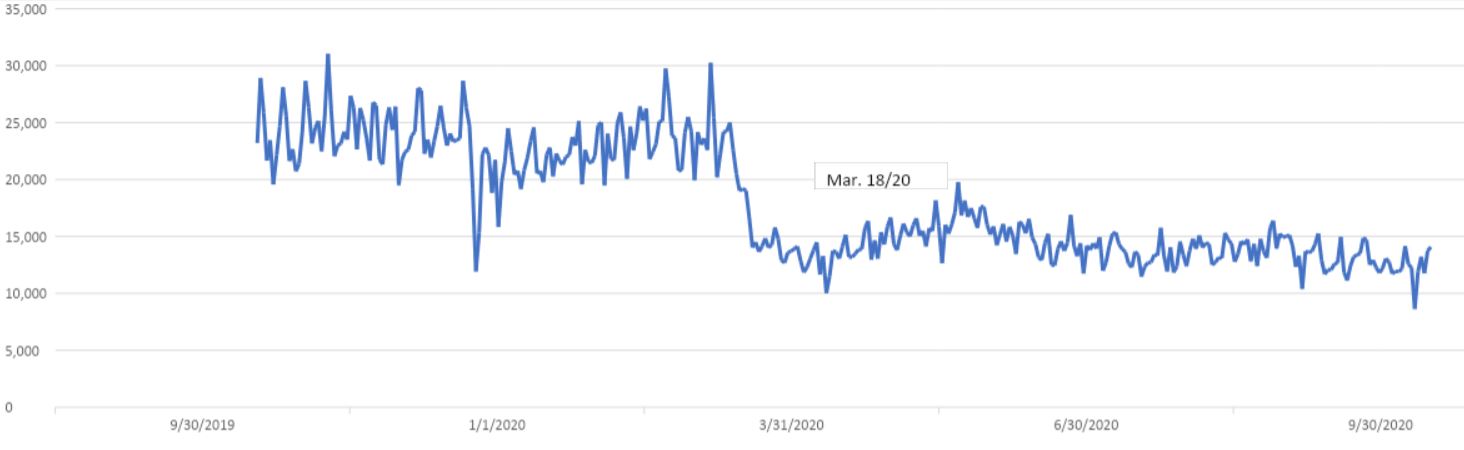
This graph shows the change in foot traffic from September 2019 to October 2020. Unsurprisingly, the Junction faced a significant drop in foot traffic, at a rate of approximately 40-50% in March 2020, with a slight increase in May/June, but at no point did we return to pre-COVID numbers.
We suspect that the boom we hoped for in July/August during the hot weather and introduction of the CafeTO program were likely offset by the trend of cottage-goers leaving the City during this time.
Foot Traffic Trends By The Hour
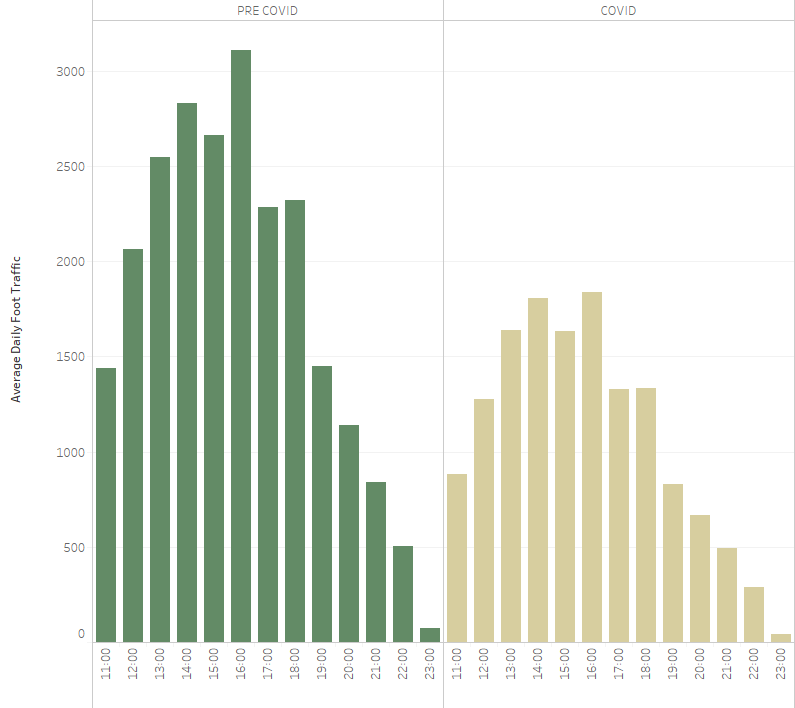
These graphs show the average daily foot traffic by the hour. As we can see, pre and post-COVID, the Junction sees its greatest foot traffic between 12pm and 6pm. Specifically, 4 pm is the key hour of the day. Consider using this time to increase your on-street marketing, such as giving out coupons or samples.
Average Foot Traffic by Day of the Week
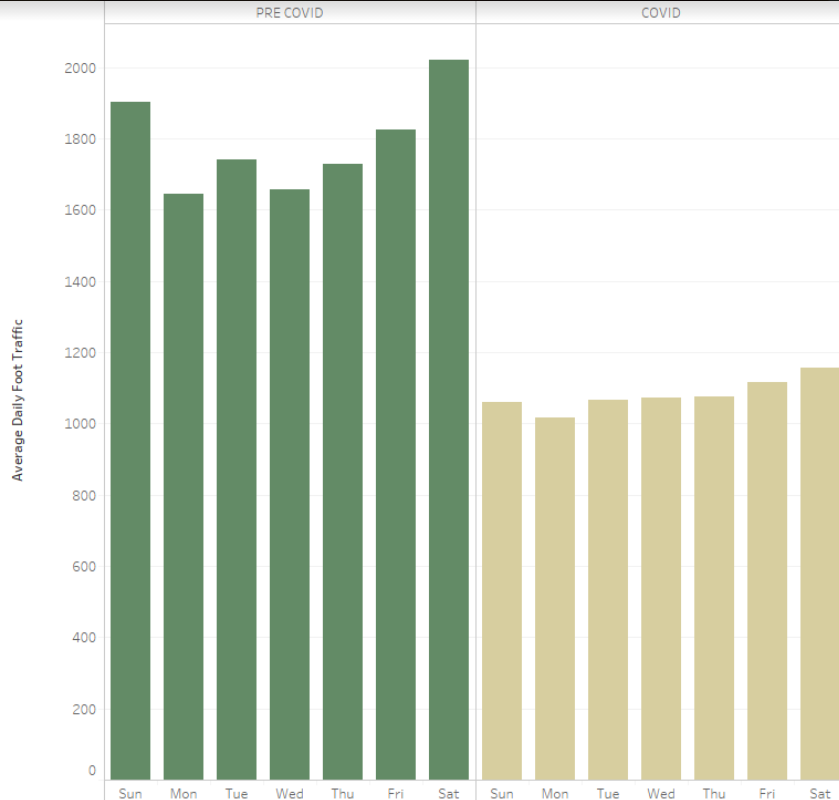
This graph shows the average daily foot traffic by day of the week. Friday, Saturday, and Sunday continue to be the Junction’s busiest days of the week. However, the gap in foot traffic between the weekend and weekday has significantly decreased, likely due to the change in many people’s work-life balance.
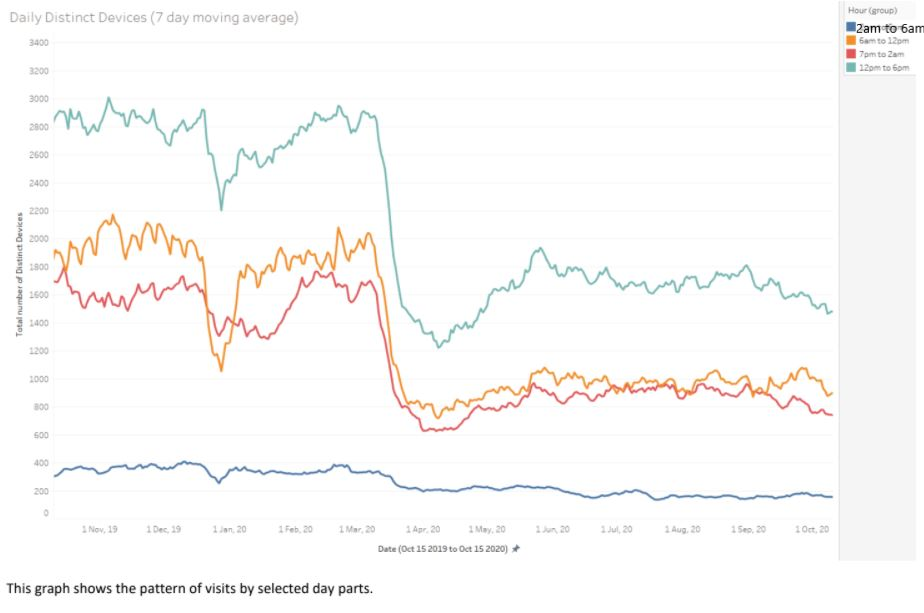
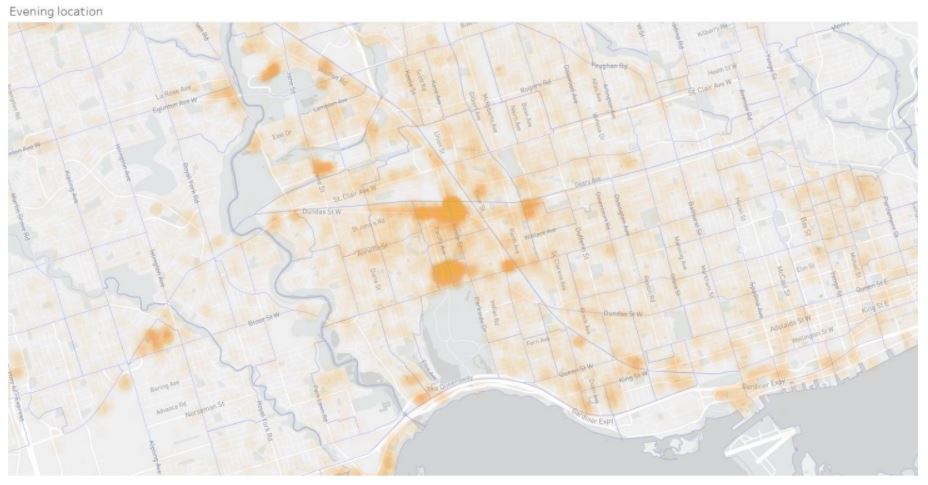
Home Locations of Junction Visitors
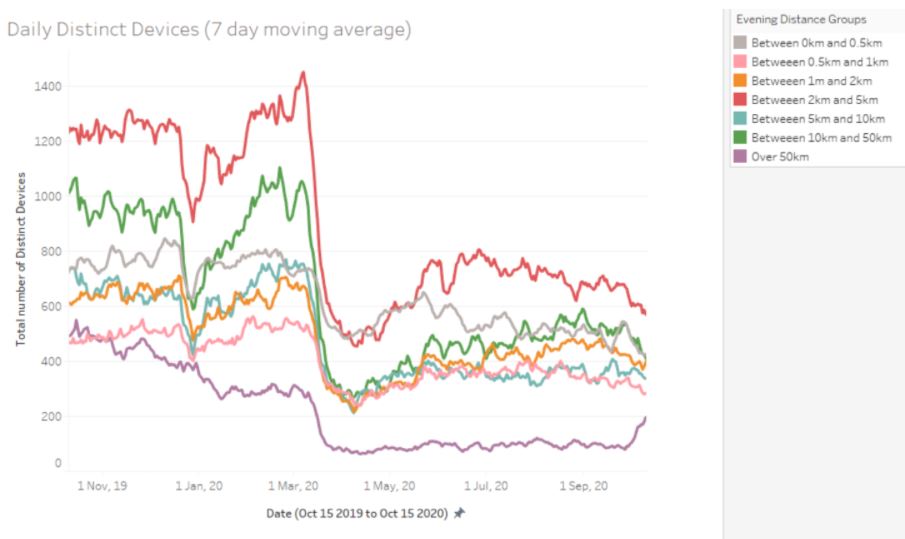
These graphs show the average count of devices by their evening location (home location). They highlight the significant impact that COVID has had on our non-local visitation. In the first graph, we see that people living closest to the Junction – the gray line – had the least change in visits post-COVID, compared to those who live further away – the red, blue and green lines. Those living over 50km away stopped coming entirely.
In the second diagram, we can see that most of the Junction foot traffic comes from those who live in the Junction, as well as nearby areas with a high density of apartment/condo buildings: surrounding High Park Station, Dundas West Station, and Lansdowne/Dupont.
When targeting your marketing on social media, continue to target people within 5km. Think about boosting your Instagram posts to this demographic! Locals continue to be the most likely to visit the Junction main street and become a new patron.